I have a new working paper out - Uncertainty Measures for Economics Journal Impact Factors. A version of the paper will appear in the March issue of the Journal of Economic Literature together with a couple of other papers on publishing in economics - one by Daniel Hamermesh and the other by Stefano Della Vigna and David Card. Some of the most recent literature review was posted here. I first blogged on this topic early last year starting with calculating the confidence interval for the Journal of Economic Growth's two year impact factor. In the end I did this for all economics journals that had a five year impact factor in the Journal Citations Reports. All 230 of them. The following graph shows the confidence intervals:
 I used a stock price chart in Excel to generate this graph! As you can see, the top two journals - Journal of Economic Literature (JEL) and Quarterly Journal of Economics (QJE) - are in a distinct class on their own. There is also a tail of a few very weak journals. I wonder why these are included in the Web of Science which deliberately only includes journals with decent citation rates. For the vast majority of journals it is hard to tell what rank they should have given the impact factor for a single year anyway. Certainly, small changes in rank from year to year which journals like to publicize when they increase have little meaning. Journals with very wide confidence intervals are those that publish few articles or have very skewed citations. In particular, the Journal of Experimental Economics ranked 23rd had one star article with far more citations than any other in the journal. It still has a respectable impact factor (1.8) without that article.
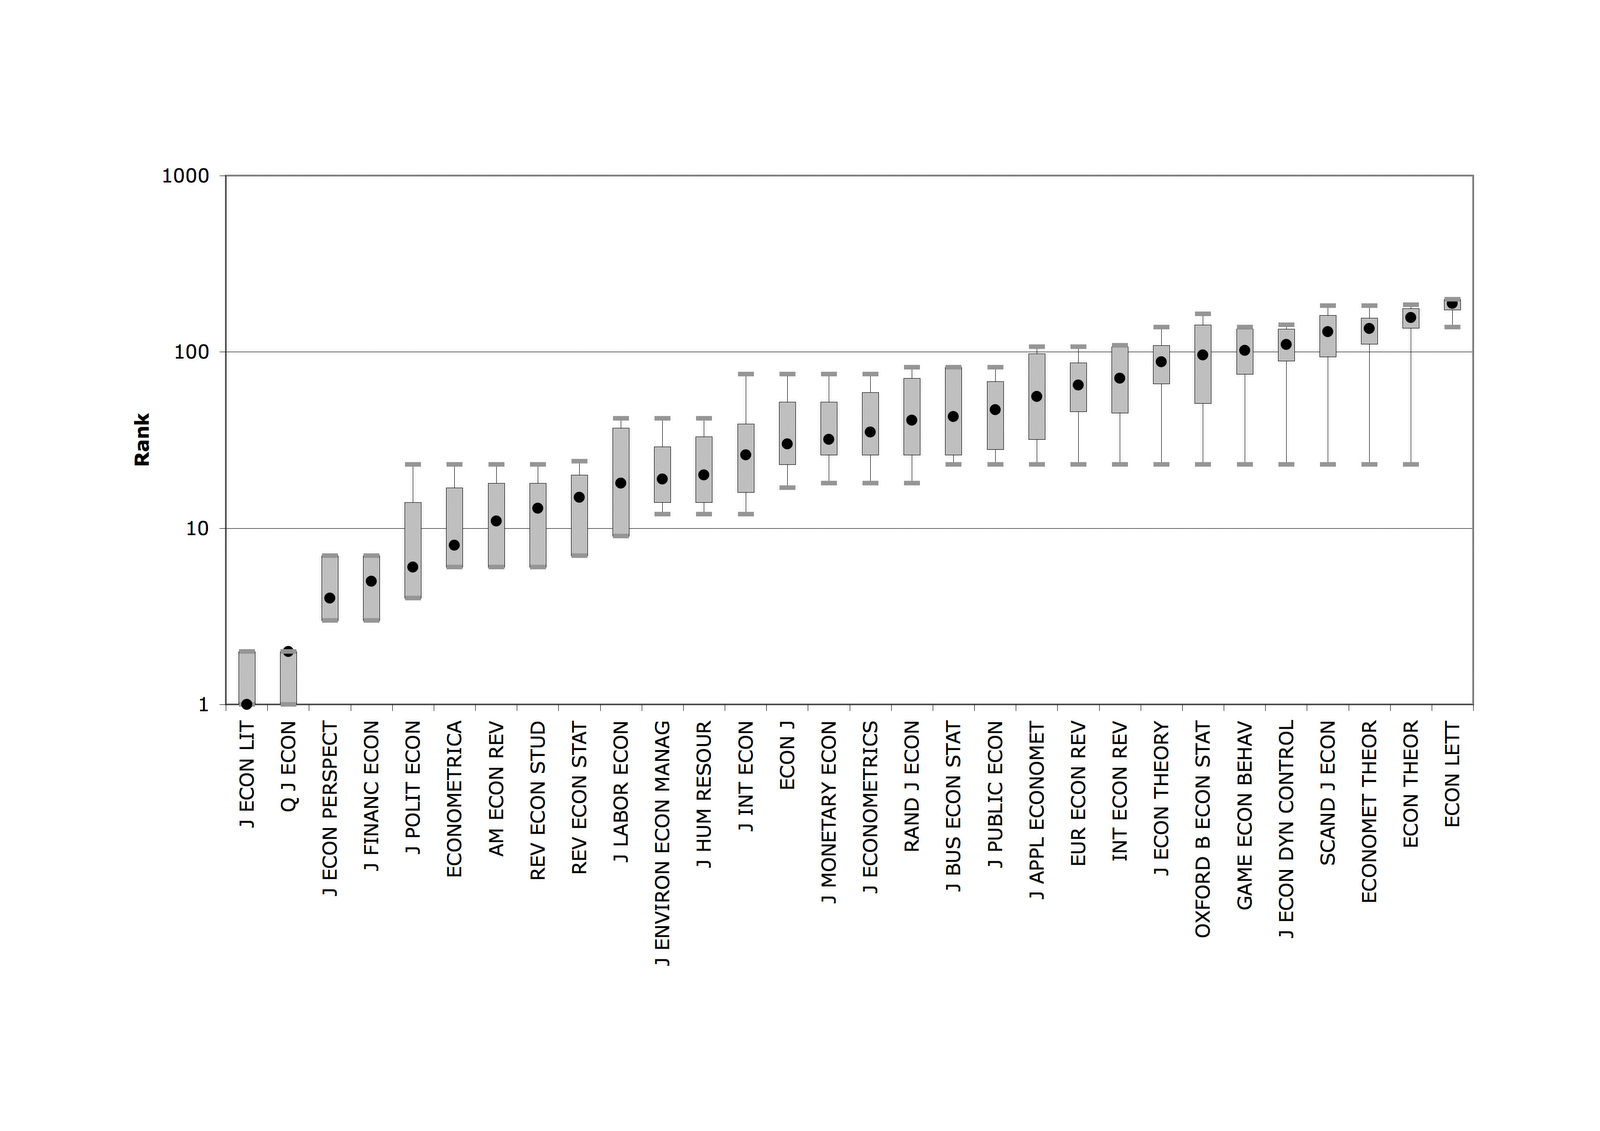
Another way of presenting the data is in terms of the range of ranks that could be ascribed to each journal:

For this graph I used the secret method for producing box plots in Excel.The shaded boxes is the continuous range of ranks that are are not statistically significantly different to the estimated rank (black dot) at the 95% confidence level. The whiskers indicate the most extreme outlying journals that have statistically insignificantly different ranks. The graph only shows the analysis for a subsample of 30 journals, though I compared each of these journals against all 229 other journals to derive the box plot. It's clear from this how much uncertainty there is over the exact ranks of most journals. The impact factor is the mean number of citations each article published in the journal got. Instead we can look at the median:
Another way of presenting the data is in terms of the range of ranks that could be ascribed to each journal:

Does this mean that impact factors are meaningless? I don't think so, but don't sweat small differences in impact factors when deciding where to submit your next academic paper.
No comments:
Post a Comment