Sunday, December 27, 2015

Annual Review 2015

I've been doing these annual reviews since 2011. They're mainly an exercise for me to see what I accomplished and what I didn't in the previous year. I ended last year noting that I had had a full year since I ended being research director at the Crawford School. I didn't know then that I would be taking on another administration/leadership role before the year was over. But, in July, I took over as director of the International and Development Economics Program. So far, this seems to be less work than being research director was and so more compatible with research productivity! In the first part of the year I was chairing the ANU submission to ERA 2015 in economics. The result was disappointing for the ANU, with economics overall falling from a 5 to a 4 as did econometrics (FoR 1403). Applied economics (FoR 1402) fell from a 4 to a 3. We have developed a strategy to turn things around and I am pretty confident we will get a 4 next time. The positive news was that economic theory (FoR 1401) went up from 4 to 5. Also, policy and administration (1605) went from 3 to 5, which was very good news for the Crawford School.


Abu Dhabi
 
Perhaps the best professional news this year is that we got awarded an ARC Discovery Projects Grant for research on "Energy Efficiency Innovation, Diffusion and the Rebound Effect." We are expecting that Zsuzsanna Csereklyei will be joining us next year to work as a post-doc on the project. My colleague Paul Burke also got a DECRA fellowship.

I am also part of a team together with Astrid Kander of Lund University and Sophia Henriques and Paul Sharp at University of Southern Denmark that won a grant from the Handelsbanken Research Foundation on “Energy Use and Economic Growth: a Long-run European Study (1870-2013). The money will mostly fund Sophia and there is some additional  travel money. As I won't be traveling to Sweden in the near future (see below), it looks like Akshay Shanker - one of our PhD students - who I am working with on a directed technological change paper - will use the money to travel to Sweden early in 2016.

Punting on the River Cherwell, Oxford
 
In July, I traveled back to the UK after returning to Australia from conferencing in the Middle East (see below). I attended a brainstorming workshop at Oxford Policy Management (in Oxford, of course, at Pembroke College) to prepare a proposal to get funding for research on electricity and economic growth and development from the UK, Department For International Development. At this point, it looks likely that our consortium will get the grant but this isn't confirmed yet.

Pembroke College, Oxford

We got four journal articles accepted for publication including our papers on carbon dioxide emissions in the short-run in Global Environmental Change and on global energy trends in Energy Economics, and articles in: Environmental and Resource Economics (still "in press") and the Journal of Cleaner Production (January 2016 publication date). In the meantime, our Energy Journal paper accepted in 2014 is still in press and doesn't yet show up on the journal website.... I also released four working papers that aren't yet published: Two with Stephan Bruns - one on research assessment using citations and another on meta-analysis of Granger causality test statistics, a third one with my former masters student Luis Sanchez, and the fourth one with a long list of coauthors headed by Bob Costanza. We have received revise and resubmits for the latter two and resubmitted the papers. I have another paper coauthored with Chunbo Ma where we also received a revise and resubmit that we are now working on. When we do, we'll also put out a working paper. We also did a revise and resubmit on a paper submitted in mid 2014, which is now under second review. I now have a spreadsheet to help keep track of all these projects!

Right now, I have ten publications in various stages of the review and publication process. Two are in press, three resubmitted after revision, two we are revising, and three in first review.  First review at that journal - we've already sent one to a bunch of other journals.

I also published two book chapters. One is an article on the energy GDP relationship in the New Palgrave Dictionary of Economics and the other a chapter in a Routledge book on energy and poverty.

One milestone this year was passing 10,000 citations on Google Scholar and an H-Index of 40. I also just went over 4,000 citations on Scopus.


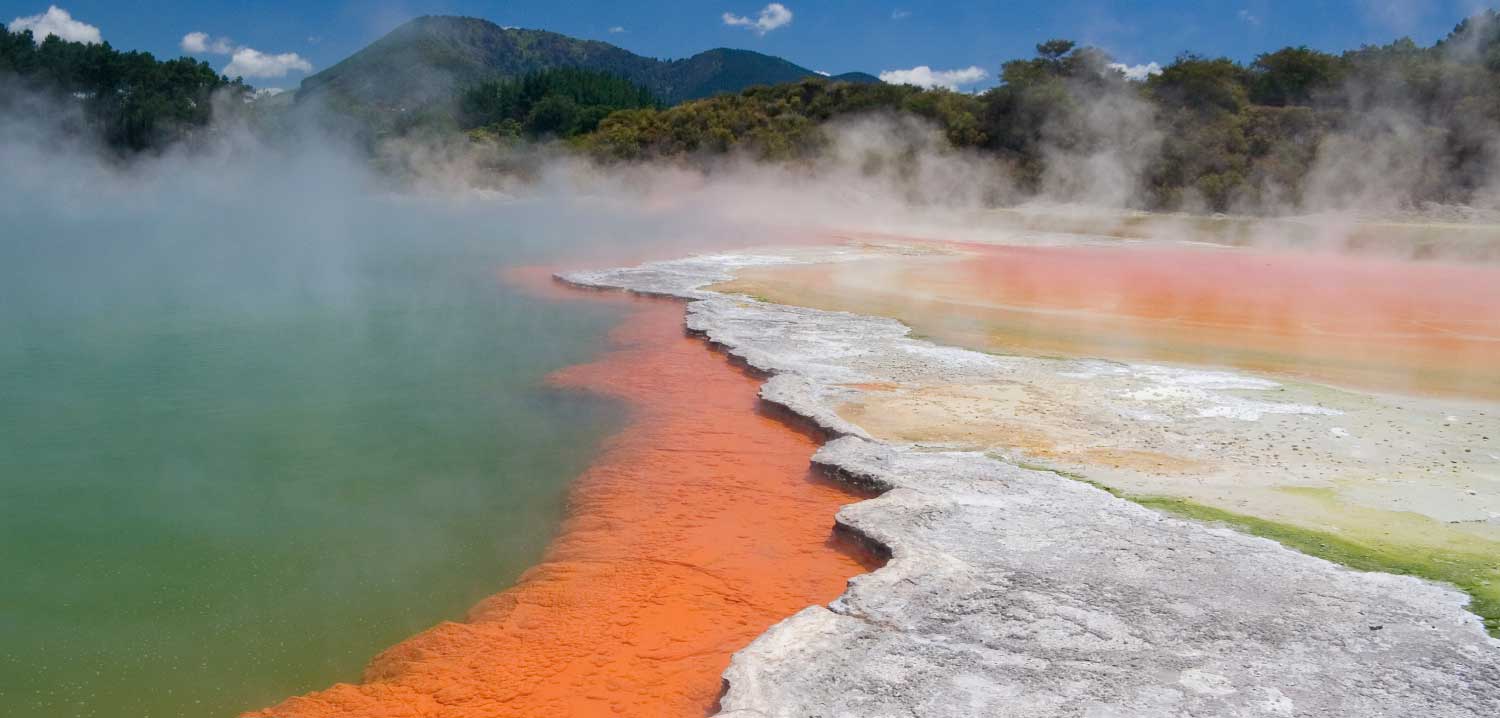
Champagne Pool, Waiotapu Thermal Area, near Rotorua

I went to the AARES conference in Rotorua in February, the IAEE meeting in Antalya, and for the first time to the International Energy Workshop, which was in Abu Dhabi. I also gave a seminar at University of Queensland in September and was invited to a workshop at Griffith University in October. Finally, I went to the Economics and Business PhD Conference at UQ in early November to comment on a PhD student's paper. Locally, I moved house and suburb in Canberra, buying a house for the first time in my life.

Since August, Donglan Zha has been visiting Crawford from Nanjing Aeronautics and Astronautics University. We are going to work on modeling concentrations of air pollution in China. I also have a new PhD student since the beginning of the year, Panittra Ninpanit. Her first PhD paper will be on decomposition of carbon emissions in Thailand using input-output analysis.

I taught the quantitative methods section of our environmental management research methods course over five weeks in the first semester. This is a tough subject to teach in such a short time slot. I thought I did well, but I got my worst evaluations so far at Crawford School. I guess most people don't like doing statistics. I also taught my energy economics course again and will continue to teach it in the future. It has been rebranded as an economics course, IDEC8089, instead of a general Crawford School course (CRWF8017). This doesn't seem to have affected participation from across different ANU programs too much.

Ecological Economics has gone to a new editorial model where there are several editors who handle much of the incoming flow of paper submissions and associate editors like me play a lower key role. I was offered to be one of the new editors, but I decided that the cost/benefit trade-off wasn't good enough and after 13 years (!) as an associate editor it was time for others to play a bigger role. I have joined the editorial advisory board for Nature Energy, a new journal that will start publishing in 2016.

As I am getting more involved in Twitter, I posted fewer blogposts this year - only 38. The most popular was: "The Industrial Revolution Remains One of History's Great Mysteries?" Second was:
"The Extent and Consequences of P-Hacking in Science" and third: "Carbon Dioxide Emissions in the Short Run: The Rate and Sources of Economic Growth Matter".

As always, it is possible to predict some of the things that will be happening in the coming year, though this year is more uncertain than most. First, I'm not sure how long I will be IDEC director for.  Our main innovation in the program that we hope happens in 2016 is a new degree targeting the private fee-paying market for masters degrees (rather than scholarship funded). I'll let you know more if it is successful. Second, my wife is expecting a baby due on 5 February. So, I haven't submitted any abstracts to conferences as I normally would.... We will see how things go.

On the predictable side, I hope to put out three new working papers early in the new year. Two will be the last two papers from our DP12 ARC grant. One is the paper coauthored with Chunbo on estimaing elasticities of substitution and the other the paper on the industrial revolution coauthored with Jack Pezzey. All the math for the latter paper is now nailed down and it is just a question of polishing. Another will be based on a paper I just submitted to the Journal of Bioeconomics for a special issue based on the Griffith workshop. As mentioned above, Zsuzsanna Csereklyei should be moving to Canberra in early 2016 to start work on the ARC grant.

Backyard at our new house

Sunday, November 15, 2015

Wrapping up ARC DP12 Project

I just submitted the final report for this funded project which has been running since 2012 to the research office. We achieved most of the project goals despite receiving much less funding than requested. I also had to take on the role of research director for the Crawford School for 2 years of the project, which took up quite a lot of my time.

On the other hand, one of the main papers is still not quite complete and another is in the revise and resubmit stage. We haven't yet put out working papers for either of those papers either. So, the reduced funding and added admin work did slow things down. So far we have published the following papers that credit the ARC for funding:

Lu Y. and D. I. Stern (in press) Substitutability and the cost of climate mitigation policy, Environmental and Resource Economics. Working Paper Version | Blogpost

Csereklyei Z., M. d. M. Rubio Varas, and D. I. Stern (2016) Energy and economic growth: The stylized facts, Energy Journal 37(2), 223-255. Blogpost

Kander A. and D. I. Stern (2014) Economic growth and the transition from traditional to modern energy in Sweden, Energy Economics 46, 56-65. Working Paper Version | Audioslides | Blogpost

Bruns S. B., C. Gross, and D. I. Stern (2014) Is there really Granger causality between energy use and output? Energy Journal 35(4), 101-134. Working Paper Version | Blogpost

Stern D. I. and K. Enflo (2013) Causality between energy and output in the long-run, Energy Economics 39, 135-146. Working Paper Version | Blogpost

As we are still completing what I think is the most important paper of the project, on the industrial revolution in Britain, this story is definitely not complete yet. In retrospect, I probably should have asked for an extension of the project at the end of last year, so that we could put in a more complete final report to the ARC next year, rather than this year.

Tuesday, November 10, 2015

Really, What is the NBN For?

What I mean is, why do we need a new government network in urban areas? We just got a "set top box" for streaming Chinese TV channels. My mother-in-law is going to be visiting :) It operates via wifi from our Telstra "modem". TV is better than reception of free Australian channels so far. Of course, there are lots of such services from Netflix etc. which seem to work in Australia without major problems. Maybe an RBN (Rural Broadband Network) is what the government should be focusing on?

Superannuation Reform

I started writing this on Twitter but it got too long :) Peter Martin proposes taxing superannuation contributions at ordinary income tax rates and then not taxing earnings or payouts of superannuation funds. This would greatly simplify the superannuation system and is the logical progression of Costello's introduction of tax free superannuation pensions and the recent move to increase the contributions tax people earning more than $300k p.a. It is equivalent to the U.S. Roth IRA. It could, in theory make running a self-managed super fund as simple as having an ordinary brokerage account (as it is in the U.S.) as the funds wouldn't owe tax.

There is one drawback, though. Taxing up front, leaves less capital to accumulate and so super payouts and the tax collected will be smaller than if instead we followed the U.S. 401k model. This is where payouts are taxed at regular income tax rates and contributions and earnings are tax free.* But, at this point, this would be a more radical change than the Roth IRA route. Existing superannuants would have to be grandfathered or they would complain about double taxation compared to current contributors. So, it's more likely we go down the Roth IRA route.

Most likely, of course, is a relatively minor change that complicates the system further or doesn't reduce the complication such as reducing the contributions tax concession to 15% across the board. Or eliminates the up-front concession but doesn't eliminate taxing superannuation earnings.

* There are probably some equilibrium effects that reduce the difference between the two....

Thursday, November 5, 2015

Hatfield Dodds et al. Nature Paper

Steve Hatfield-Dodds has published a paper today in Nature with many other CSIRO colleagues titled Australia is ‘free to choose’ economic growth and falling environmental pressures. It is the result of a integrated assessment modeling analysis of Australia and the global economy under a variety of climate policy and other scenarios.

Steve comments on the paper:

"“Our key finding is that Australia can break the links between economic growth and environmental pressure, with key pressures falling or stable while the economy more than doubles in size out to 2050.  This can be achieved through mobilising proven technologies through extensions of established policy approaches.  Our analysis suggests other countries can also ‘decouple’ economic growth from environmental damage.

We do not find, however, that environmental pressures can be reduced for free.  In most cases, reducing environmental pressure results in economic growth being a little slower than it would be in the short term, but then stronger in the long term.  In some cases – like energy efficiency – reducing environmental pressure results in stronger economic growth almost immediately.

But perhaps the most striking aspect of the results is that very large reductions in environmental pressures – including reversing the loss of native habitat in our agricultural landscapes, or achieving zero or lower net greenhouse gas emissions – have relatively modest impacts on income and living standards, whether the impacts are positive or negative.

The analysis represents a number of scientific advances, accounting for multiple aspects of resource use and environmental performance, and locating these in the context of economic activity and growth.  This allows us to explore the relationships between essential services humanity derives from nature, including energy, food, and clean water, and the environmental footprint of these services.

The analysis also explores the different kinds of choices involved in shifting towards a more sustainable future.  We find that while individual choices by businesses and households make an important contribution, policy choices are crucial.  We also find that changes in social values are
not required to make progress towards sustainability over coming decades.”

By contrast, a News and Views article in the same issue of Nature by Benjamin Bodirsky and Alexander Popp suggests that a better way forward would be " investing carbon-tax revenues in education and science, establishing markets for flexible electricity consumption, providing bicycle and public transport infrastructure and promoting healthy and sustainable diets." They argue that then less strict regulation would be needed to keep the economy within environmental boundaries. While I think this could help, I don't think it is likely to make a major contribution to the change needed by 2050.

I was asked to provide expert comment on the Hatfield-Dodds paper for a press release. I commented:

"“The paper by Hatfield-Dodds et al. is similar to many existing studies including those reviewed in IPCC reports using Integrated Assessment Models, which are simulation models of the economy and environmental impacts that result from economic development and climate policies. They claim that they include more environmental impacts and indicators than previous research.

They simulate various scenarios including existing trends where current climate policies continue both globally and in Australia and a no climate policy scenario, which they call "material intensive" and strong climate policies globally and in Australia.

In common with most existing mainstream studies they find that strong policies to abate greenhouse emissions do not prevent economic growth. This is in contrast to what they call "Communitarian Limits" approaches like Tim Jackson's book "Prosperity Without Growth" that claim that economic growth must stop in order for society to have a chance at dealing with climate change.

The surprising finding in the paper is that there are scenarios where the economy doesn't just continue to grow under a strong climate policy but that income per person is actually higher than under current trends - "Win-Win". This seems to be because Australia gains from changes in the global economy under the strong climate policies. For example, other countries pay to plant trees in Australia to capture carbon dioxide.”

Friday, October 30, 2015

Discovery Projects 2016

We - myself together with Stephan Bruns and Alessio Moneta - got an ARC Discovery Projects grant. Thanks also to Zsuzsanna Csereklyei who contributed to the development of the proposal and who we may hire as a post-doc using the grant - depending if she wants to come to Australia for the time we will be able to afford to fund with the money we received ($A273k - 65% of what we requested). This is my second ARC grant following the DP12 grant that we got a few years ago. The title of our project is: "Energy Efficiency Innovation, Diffusion and the Rebound Effect". We will be looking at the diffusion of energy efficiency innovations and trying to measure the economy-wide rebound effect empirically. This was our second attempt at applying for a grant on this topic. Last time around we were rated in the top 10% of unfunded proposals and so I thought it was worthwhile revising and resubmitting!

Other good news today is that my colleague, Paul Burke got a DECRA grant. I think this is our fourth DECRA at Crawford. Congratulations to Paul! Also Peter MacDonald and Robert Sparrow got a DP16 grant. Congratulations to Robert and Peter!

Google Scholar Matures

Since it was introduced in late 2004, Google Scholar has rapidly grown to become a widely used tool for finding and assessing the impact of academic literature. The database still suffers from noise relative to its competitors Scopus and Web of Science but it has broader coverage, especially in the social sciences and humanities and is open access. As the database developed, Google have periodically added new information sources to the database. This resulted in a rapid growth in estimated citations of articles in the early years. However, it now seems that the database has matured. The following graph shows the growth rate of citations to my research in the previous 12 months, measured monthly since 2009 for Google Scholar in blue and a bit more intermittently for Scopus in red. I have also fitted exponential trend lines to the two series:

Initially the growth rate of Google Scholar citations was very high and very erratic. But the month to month variation in the annual growth rate has reduced drastically over time. By contrast, the growth rate of Scopus citations has been much more consistent, with a slow rate of decline in the percentage growth rate over time. Interestingly, the two series have also converged to a common growth rate of 17-18% per year. So, it seems that Google's database is now as mature as Scopus is. This doesn't mean that Google is now as high a quality data source as Scopus is. It isn't. But large revisions to citation counts or additions of large new data sources seems to be a thing of the past.

Tuesday, October 20, 2015

Business as Usual Emissions Projection from Sanchez and Stern Econometric Model

I finished preparing my presentation for Thursday in Brisbane. The topic of my talk is "Drivers of Industrial and Non-Industrial Greenhouse Gas Emissions". It's mostly based on my paper with Luis Sanchez. I'm also adding some material from Chapter 5 of the IPCC AR5 report (WG3) to give context. This is because this "trends and drivers" research theme came out of my work on the IPCC chapter. Reyer Gerlagh produced our original "iconic image" (yes, we called them that in the IPCC process) of the long-run growth rates of emissions and income per capita and then I suggested to do an econometric analysis along those lines. I think it was Reyer also who suggested how to model the EKC in a growth rates model.

I've also "added some value" by doing a business as usual projection using our model. This is something we are thinking to do as part of the revise and resubmit for a related paper. The graph shows projections to 2030 for 3 developing and 3 developed countries and the world (well, our 129 country sample) as a whole:


Indonesia and India have similar income per capita, so an EKC model would project similar emissions growth in both countries. The graph shows the value added of our model, which suggests that emissions will grow slower in Indonesia, which is more emissions intensive. The global outcome is similar (a little bit higher) to RCP 8.5, which is the highest emissions growth scenario used in AR5. RCP 8.5 assumes slower economic growth than we are here but slower than historic progress in energy intensity.

To get the projection, I used our model parameters estimated for the 1991-2010 period and the UN median projection for population growth. I used USDA ERS projections for economic growth rates in each country. Other variables are at their values for 2010.

Monday, October 19, 2015

Managing the Transition to a Sustainable Economy


On Thursday morning at 9:35am I'll be presenting at the Managing the Transition to a Sustainable Economy Conference at Griffith University in Brisbane. I'll be presenting my paper on Drivers of Industrial and Non-Industrial Greenhouse Gas Emissions. This is a slight change from the original paper I was supposed to present, as that got published in the meantime, and the organizers only want unpublished research. I blogged about the paper in March. Right after me, John Foster is speaking.  John Gowdy from my former university RPI is also speaking at the conference. The full schedule is here.

Monday, September 28, 2015

Influential Publications in Ecological Economics Revisited

Back in 2004 I published with Bob Costanza, Chunbo Ma, Brendan Fisher, and Lining He a paper that looked at the most influential publications on the field of ecological economics. Then, about this time last year Gaël Plumecocq contacted me about participating in a session he was organizing at the European Society of Ecological Economics meeting in Leeds on "ecological economics understood as an epistemic community". I had the idea of revisiting our 2004 paper a decade later and seeing how the field had changed in the meantime. Eventually, Gaël also came on board our author team, contributing a textual analysis of the key themes in the influential papers. Gaël gave a presentation on the paper at ESEE and now we finally have a working paper version of our new paper on the web. The full author team includes: Bob Costanza, Rich Howarth, Ida Kubiszewski, Shuang Liu, Chunbo Ma, Gaël, and myself.

We downloaded from the Web of Science (WoS) information on all the papers published in Ecological Economics from 2004 to 2014 including the number of citations each received and the full reference list from all 2960 articles. We define outwardly influential papers as the 10% of articles published in the journal in each year from 2004 to 2014 that received the most citations in the Web of Science. The inwardly influential publications are all publications that received more than 15 citations in the journal in the period 2004-2014. For each of these publications we collected the total number of citations in the Web of Science, Google Scholar, and Ecological Economics. The inward influence data needed a lot of cleaning up, which was mainly done by Chunbo and Ida with my help.

Shuang produced these graphs of inward and outward influence using Tableau:


For inward influence, there are many publications at the bottom right that have been relatively much more influential across science as a whole than they have been in ecological economics. Publications towards the left have been mostly influential in ecological economics alone. By contrast, there is a stronger correlation between citations received in the journal and more broadly for the outwardly influential articles. One outlier is the Pimentel et al. paper on the costs of invasive species that is the most cited article (by WoS cites) ever published in ecological economics.

The theme analysis found, as we expected, that the most influential topic was ecosystem services and payments for ecosystem services, which received 25% of the citations of the influential publications. By contrast, sustainable development and foundations of ecological economics were the most influential topics prior to 2004.

We also followed up on my 2006 paper with Chunbo Ma by looking at the journals, which cite Ecological Economics the most and which are cited by Ecological Economics the most:


There have been quite dramatic changes in these lists with more than half the journals being new entrants. In general there has been an increase in citation links to interdisciplinary environmental science and environmental studies journals and a reduction in links to mainstream economics journals including environmental economics journals. No general interest economics journals are now on the top 20 inward and outward lists.

We think that these trends reflect a maturation of ecological economics as a transdisciplinary field.

Wednesday, September 23, 2015

Nature Energy

I have joined the editorial advisory board for Nature Energy, a new journal from the Nature Group that will begin publishing at the beginning of 2016. The position involves giving feedback on submitted manuscripts, but I can also make suggestions for commentary and news and views articles. The latter are a special feature of Nature journals that provide less technical overviews of articles published both in Nature journals and other academic journals. I would appreciate any suggestions you might have for upcoming articles that the journal might cover in news and views, or topics/authors for commentaries.

Thursday, August 27, 2015

Global Energy Use: Decoupling or Convergence Accepted to be Published in Energy Economics

My paper with Zsuzsanna Csereklyei on trends in global energy use and whether they can be better explained by decoupling or convergence in energy intensity or some mixture has been accepted to be published in Energy Economics. I wrote a blogpost about the paper in December last year when we first completed the paper.

This was not a bad review experience though Zsuzsanna who is in a short-term post-doc position would have liked it to be faster! We first sent the paper to World Development who desk-rejected it. Then we sent it to Energy Economics. The first review took seven months due to one of the referees dropping out due to family health problems and then the journal needed to get another referee. We turned around the paper in 12 days and then got a conditional acceptance a month later. We turned that around in one day and got the final acceptance a day later. This paper applies the method developed in Anjum et al. (2014) to energy and also adds treatment of spatial autocorrelation. The whole process of writing and publishing this paper took place while Anjum et al. has been in review...

Update 5 October

The journal also got the final version of the paper with page numbers onto the web incredibly quickly following us returning the final proofs.

Monday, August 24, 2015

Having Small Government Should Never Be a Reason for Making It Bigger

It seems that the Grattan Institute argues in its submission to the National Reform Summit that because Australia's government is relatively small by the standards of other developed countries we can or should increase its size. This argument makes no sense to me, though it seems to be often made. Perhaps other countries spend inefficiently or perhaps Australians are not interested in spending on some of the things that those countries spend on. We should look first at the outcomes we have as a country and, if there are poor outcomes that Australians would like improved, we then need to ask whether government can make a difference. Only then does it make sense to ask whether spending or taxes should be higher. I don't think this is really a political statement, as I leave open the final choice on whether to increase the size of government or not. But it makes no sense to talk about increasing the size of government simply to be nearer OECD means.

As for whether we should change the taxation arrangements for superannuation the simplest, fairest, and possibly relatively efficient  approach is to use the same approach as US 401k and 403b funds and tax payouts at normal income tax rates but not tax contributions or earnings in the accumulation stage. It's simple to show that under reasonable assumptions that this approach generates higher retirement incomes than the current Australian approach. It also has the huge advantage of reducing bureaucracy. Self managed superannuation funds are costly to run in Australia because of the need for accounting and auditing to make sure that they are paying the correct taxes. In the US, an IRA is just like another brokerage account except for the rules on contributions and withdrawals, which can be managed by the broker.

Sunday, August 9, 2015

The Extent and Consequences of P-Hacking in Science

Interesting paper from my biology colleagues at ANU on the effects of "p-hacking" - searching for more significant results by looking at various statistical models or samples and picking the more significant ones to report - on reported science. They conclude that when there is a strong real effect it can be detected despite p-hacking by looking at the "p-curve". The p-curve is the distribution of p-values across all the studies collected in a meta-analysis. If the curve is skewed right - there is a peak at very high significance levels (numbers a lot smaller than 5%) then there is a real effect. However, p-hacking can inflate the estimated size of the effect if we use a simple average of effect sizes in the literature. The main novelty of their paper I think is that they collected a large number of p-values from various fields of science using text-mining to test these ideas in the empirical literature.

In meta-analysis in economics, a popular approach is to test the effect of degrees of freedom or precision (inverse of the standard error) on the values of the reported test statistics using regression analysis. This effect is called the power-trace. The idea is that if there is a true effect, then, due to increasing statistical power, reported test statistics will be more significant the higher the degrees of freedom in the underlying study.* Some of these methods can also be used to estimate the true effect size adjusted for publication bias.

In our meta-analysis of energy-GDP Granger causality tests we also present graphs of the distribution of the test-statistics. These seemed to be roughly normal with a mean of about 1, which means there is excess significance in this literature but that the mean test statistic is not statistically significant (the solid histogram in the background is the standard normal distribution):


To help interpret these graphs, note that a normal test statistic (-probit(p)) of zero means that the original Granger causality test p-value was 0.5. A test statistic of 1.65 implies that the original p-value was 0.05 and a test statistic of -1.65 implies that the p-value was 0.95. The econometric analysis in the paper showed that there was no statistically significant relationship between these test statistics and degrees of freedom, also suggesting that there was no genuine effect. We showed in the paper that there did seem to be a robust effect from GDP to energy when underlying studies controlled for energy prices.

We didn't report the actual p-values though, and so I am curious what the p-curves look like. First I made a couple of histograms with bins for each 1% increment of p-values:


Uh-oh! The mode is for 0-1%! According to Head et al.'s methodology that means there is a true effect in each direction of causality. When I broke down the range from p=0 to p=0.1 into 100 bins, again the mode was for the smallest value. So, what does it mean when the overwhelming majority of studies find results that are less significant than the 1% or 0.1% level and yet the mode is for 0-1% or 0-0.1%? And when these results are for not particularly large sample sizes? Either the p-curve or the meta-regression/power trace method is wrong here. One hypothesis is that non-stationarity in macro-economic time series and the over-fitting problem discussed in our paper result in many spuriously significant test statistics in relatively small samples that wouldn't arise with more classically behaved data.

* Though this method can detect a "genuine effect" there is no guarantee that this is a "causal effect". If no studies control for the relevant variables or effects to identify a causal effect then the meta-analyst won't be able to detect a causal effect either. Similarly, if the meta-analyst doesn't control for all the relevant variables included in the underlying studies they may also fail to identify a causal effect when some papers do identify one. All the meta-analyst can find is a robust partial correlation in the underlying studies if one exists.

Saturday, August 8, 2015

Donglan Zha

Donglan Zha is visiting Crawford School for the next year. She is an associate professor at Nanjing University of Aeronautics & Astronautics and works on energy economics including research on substitution possibilities and the rebound effect. Her office is in Constable's Cottage across the road from the main Crawford Building. Her ANU e-mail address is donglan.zha@anu.edu.au. Please welcome Donglan to the Crawford School, I'm sure she will be happy to meet with you.

Monday, August 3, 2015

International Energy and Poverty: The emerging contours

New book that will be released this month: International Energy and Poverty: The emerging contours. I am the authors of the introductory chapter on energy and growth. There will be a book launch at University of Denver on 11 September at 9:30am as part of the "Access to Energy for All" event. Contact Lakshman Guruswamy for details if you want to attend.

Thursday, July 30, 2015

Scopus Adds More Article Level Metrics

Scopus has added a new set of article level metrics. I think the most interesting one is "Field-Weighted Citation Impact" which tells you how cited your article is relative to other similar articles. I think this metric has a big potential in tenure and promotion cases. Here is Scopus' explanation:


Field-weighted Citation Impact (FWCI) 

Field-Weighted Citation Impact is sourced directly from SciVal.


As defined in Snowball Metrics, Recipe Book/Field-Weighted Citation Impact Field-Weighted Citation Impact is the ratio of the total citations actually received by the denominator’s output, and the total citations that would be expected based on the average of the subject field. A Field-Weighted Citation Impact of:
  • *Exactly 1* means that the output performs just as expected for the global average.
  • More *than 1* means that the output is more cited than expected according to the global average. For example, 1.48 means 48% more cited than expected.
  • Less than 1 means that the output is cited less than expected according to the global average.
Field-Weighted Citation Impact takes into account the differences in research behaviour across disciplines. It is particularly useful for a denominator that combines a number of different fields, although it can be applied to any denominator.
  • Researchers working in fields such as medicine and biochemistry typically produce more output with more co-authors and longer reference lists than researchers working in fields such as mathematics and education; this is a reflection of research culture, and not performance.
  • In a denominator comprising multiple disciplines, the effects of outputs in medicine and biochemistry dominate the effects of those in mathematics and education.
  • This means that using non-weighted metrics, an institution that is focused on medicine will appear to perform better than an institution that specialises in social sciences.
  • The methodology of Field-Weighted Citation Impact accounts for these disciplinary differences.

Sunday, July 12, 2015

Increasing Requirements for Publication

From "Accelerating Scientific Publication in Biology":

Somewhat tongue – in - cheek, let’s imagine a contemporary editorial decision on the 1953 Watson and Crick papers (assuming that they were submitted together):

“Dear Jim and Francis: Your two papers have now been seen by three referees. Based upon these reviews, I regret to say that we cannot offer publication at this time. While your model is very appealing, referee 3 finds that it is somewhat speculative and premature for publication. Indeed, your model proposing a semi-conservative replication of DNA raises many obvious questions. As two of the referees point out, it should be possible to determine experimentally if the two strands can separate and serve as templates. This would address referee 3’s concern that strand separation is not feasible thermodynamically. I regret to say that without such experimental evidence, we will not be able to publish your work in Nature and suggest publication in a more specialized journal. Should you be able to furnish more direct experimental evidence, we would be willing to reconsider such a revised paper. Naturally we would need to consult our referees once again. Furthermore, since space in our journal is at a premium, if you do decide to resubmit, then we recommend that you combine your two submitted papers into a single and more cohesive Article, potentially including the X-ray studies of your colleagues at Cambridge. Thank you again for submitting your papers to Nature. I am sure that this revision will delay your Nobel Prize and the discovery of the genetic code by only one or two years."

Saturday, July 11, 2015

Papers from Google Scholar

One way that I keep up to date is to track the papers that cite me using Google Scholar alerts. This time I thought some of the papers were more interesting than usual, particularly the economic history papers. Well it's one way to produce a quick blogpost :)

Y Ren, D Parker, G Ren, R Dunn - Climate Dynamics, 2015
Abstract The spatial and temporal pattern of sub-daily temperature change in mainland
China was analysed for the period from 1973 to 2011 using a 3-hourly dataset based on 408
stations. The increase in surface air temperature was more significant by night between ...

H Nielsen
Abstract This paper examines the role of foreign trade in the consumption of primary energy
in the Czech Republic and to what extent adjustment for energy embodied in trade effects
the country's energy intensity curve. As opposed to previous studies, this article takes a ...

G Esenduran, E Kemahlıoglu-Ziya, JM Swaminathan
ABSTRACT In the last two decades, many countries have enacted product take-back
legislation that holds manufacturers responsible for the collection and environmentally
sound treatment of end-of-use products. In an industry regulated by such legislation, we ...

R Hölsgens, B Gales, JP Smits, F Notten
In this paper we analyze recent estimates of annual CO2 (carbon dioxide) emissions from
energy consumption in the Netherlands since 1800 alongside another emission to air
resulting from energy consumption: SO2 (sulfur dioxide). The new time series on CO2 can ...

E Ömer, M BAYRAK - Anemon Muş Alparslan Üniversitesi Sosyal Bilimler …, 2015
Özet Enerji; kullanım şekli, miktarı, bileşimi, yapısı ve mahiyetiyle ekonomik ve sosyal
gelişmişliğin temel ölçütlerinden biridir. Bir ülkede mevcut enerji arzının enerji talebini
karşılayamadığı durum olarak tanımlanan enerji açığı; büyüme ve kalkınma sürecinde, ...

R Hölsgens, C Ducoing, M Rubio, B Gales
Abstract The relationship between energy and capital is one of the most important
relationships of modern economic growth. Machines need energy to produce all the goods
we enjoy; energy without machinery is useless. However, the great majority of the ...

Z Guevaraa, JFD Rodriguesc, T Domingosb
Abstract Conventional energy input-output models were developed about 40 years ago and
have not been significantly improved since. These conventional models offer a limited
description of energy flows in the economy. This paper introduces a novel energy input- ...

M Amoah, O Marfo, M Ohene - Forests, Trees and Livelihoods, 2015
Firewood is the dominant fuel type used by rural households in Ghana. However, the
scarcity of firewood species has raised concerns about the sustainable use of this fuel type.
This study investigated the firewood consumption pattern, firewood species used by rural ...

B Deng, Y Li
Abstract: Efficiency Power Plant (EPP) promotes the use of energy-efficiency power plant
technology and energy efficient equipment, coupled with its low-input, zero pollution, zero
emissions and other advantages, has an important role in the control of energy ...

JD Urrutia, MLT Olfindo, R Tampis
Abstract: The researchers aim to formulate a mathematical model to forecast Exchange Rate of the Philippines from the 1st Quarter of 2015 up to the 4th Quarter of 2020 using
Autoregressive integrated Moving Average (ARIMA). The researchers used the data ...

Monday, July 6, 2015

Energy Leapfrogging (or Not)

Arthur van Benthem has a recent paper in the Journal of the Association of Environmental and Resource Economists titled "Energy Leapfrogging". The main thesis of the paper is that despite presumed improvements in the energy efficiency of individual technologies such as cars and refrigerators, energy intensity in developing countries today is similar to what it was in today's developed countries when they were at a similar income level. There is no "energy leapfrogging". This is also an implication of our paper "Energy and Economic Growth: the Stylized Facts". If there has been an almost constant log-linear relationship between energy use and GDP per capita then there is no energy leapfrogging.

van Benthem suggests that a major contributor to this is that the consumption bundle in developing countries today is much richer in energy services like personal transport than was the consumption bundle at a similar level of development in today's developed countries. Consumers have substituted towards these now cheaper energy services (what are they consuming less of though?).

On the face of it, this suggests that there would be a very large rebound effect due to substitution towards energy services. This is on top of any indirect rebound effect due to increased energy productivity boosting income and thus energy demand as originally proposed by Harry Saunders.

On the other hand, there must be some shift away from energy services as income increases so that energy intensity is lower in richer countries. Anyway, this is pretty speculative but worth thinking about, I think.

Thursday, June 25, 2015

Changes at ANU

Yesterday we heard the surprising news that Brian Schmidt would be the next vice-chancellor (president) of the ANU. Here at Crawford there is change too with the recent announcement that Tom Kompas would step down as School director after five years. We will be searching for a new school director and in the interim Bob Breunig will be acting director. That means that director of the International and Development Economics Program became vacant. I have agreed to be acting director of the program while Bob is directing the School (till 15 July 2016). There is more to the program that just the Masters of International and Development Economics. We also have a Masters of Environmental and Resource Economics. Effectively, though, it is the department of economics located at the Crawford Building. Crawford also has another department of economics - the Arndt-Corden Department of Economics - located in the Coombs Building. I was based there in 2009-2010. Other changes at Crawford is that Frank Jotzo is becoming deputy director of the School and John McCarthy is replacing him as READ director. I am leaving the READ group.


Monday, June 22, 2015

Population, Economic Growth and Regional Environmental Inefficiency: Evidence from U.S. States

I have a new paper in the Journal of Cleaner Production coauthored with George Halkos and Nikalaos Tzeremes. George was a lecturer at University of York when I was a post-doc there. We haven't previously put out a working paper version of this paper.

In this paper, we apply a conditional directional distance function allowing multiple exogenous factors to measure environmental performance to evaluating the air pollution performance levels of U.S. states for the years 1998 and 2008. The overall results reveal that there is much variation in environmental inefficiencies among the U.S. states. A second stage nonparametric analysis indicates a nonlinear relationship between states’ population size, GDP per capita levels and states’ environmental inefficiency levels.

Our results indicate that environmental inefficiency on the whole decreases with increased population and income per capita but there are limits to this improvement and at high income and population levels the tendency may reverse. In particular, small poor states tend to be environmentally inefficient, whereas large states tend to be more efficient regardless of their level of income. The results show that there is not so much of a trade off between environmental quality and economic development in small and poor US states in the South and Mid-West. As these states grow in income and population they can improve their environmental efficiency. However, large and richer states face more environmental challenges from growth. This may explain the differences in policy across states. For example, California which is already an environmentally efficient state is also a state which has lead in environmental regulation. There are fewer local environmental policies in states across the South and parts of the mid-West. Politicians and populations in these states may see less trade off between environmental quality and development and hence be reluctant to adopt specific environmental policies. These patterns also match recent trends in voting for the Republican and Democratic parties the so-called Blue and Red States. However, there are exceptions to a simplistic analysis along these lines as Texas for example is an environmentally efficient state in our analysis as would be expected from its large population size.

Wednesday, June 17, 2015

Meta-Granger Causality Testing

I have a new working paper with Stephan Bruns on the meta-analysis of Granger causality test statistics. This is a methodological paper that follows up on our meta-analysis of the energy-GDP Granger causality literature that was published in the Energy Journal last year. There are several biases in the published literature on the energy-output relationship, which we document in the Energy Journal paper:

1. Publication bias due to sampling variability - the common tendency for statistically significant results to be preferentially published. This is either because journals reject papers that don't find anything significant or more likely because authors don't bother submitting papers without significant results. So they either scrap studies that don't find anything significant or data-mine until they do. This means that the published literature may over-represent the frequency of statistically significant tests. This is likely to be a problem in many areas of economics, but especially in a field where results are all about test statistics and not about effect sizes.

2. Omitted variables bias - Granger causality tests are very susceptible to omitted variables bias. For example, energy use might seem to cause output in a bivariate Granger causality test because it is highly correlated with capital. This is a very serious problem in the actual empirical Granger causality literature, which I noted in my PhD dissertation.

3. Over-fitting/over-rejection bias - In small samples, there is a tendency for vector autoregression model fitting procedures to select more lags of the variables than the true underlying data generation process has. There is also a tendency to over-reject the null hypothesis of no causality in these over-fitted models. This means that a lot of Granger causality results from small sample studies are spurious. We realized in our Energy Journal paper that this was also a serious problem in the empirical Granger causality literature. The following graph illustrates this using studies from the energy-output causality literature:


Each graph shows normalized test statistics for causality in one of the two directions. Rather than fit models with more lags in larger samples, researchers tend to deplete the degrees of freedom by adding more lags. Therefore, there tend to be fewer degrees of freedom for studies with three lags than with two, and fewer for those with two than with one. Also, we see that the average significance level increases as the lags increase and degrees of freedom reduces.

Of course, the second two types of biases give researchers additional opportunities to select statistically significant results for publication and so, more generally, "publication bias" includes selection of statistically significant results from those provided by sampling variability and by various biases.

The standard meta-regression model used in economics deals with the first of the three biases by exploiting the idea that if there is a genuine effect then studies with larger samples should have more statistically significant test statistics than smaller studies. If there is no real effect then there will be either no relation or even a negative relation between significance and sample size. Meta-analysis can test for the effects of omitted variables bias by including dummy variables and interaction terms for the different variables included in primary studies. Finally, in our Energy Journal paper we controlled for the over-fitting/over-rejection bias by including the number of degrees of freedom lost in model fitting in our meta-regression.

The new paper focuses on the latter issue and examines both the potential prevalence of over-fitting and over-rejection and the effectiveness of controlling for over-fitting. The approach used in this paper is a little different to the Energy Journal paper - here we include the number of lags selected as the control variable. We show by means of Monte Carlo simulations that, even if the primary literature is dominated by false-positive findings of Granger causality, the meta-regression model correctly identifies the absence of genuine Granger causality. The following graphs show the key results:

Power is the probability of reject the null hypothesis of no causality when it is incorrect - so here we have set up a simulated VAR where there is causality from energy to GDP. Mu is the mean sample size of the primary studies in our simulation and var is the variance. So, the lefthand graph is a simulation of mostly small sample studies. The middle one has a mixture of small and large studies, and the right hand graph has mostly large studies (but a few small ones too). The meta sample size is the number of studies that are brought together in the meta-analysis. DGP2a is a data generating process with a small effect size - DGP2b has a larger effect size.

So, what do these graphs show? When the samples in primary studies are small and we only have a meta sample of 10 or 20 studies, it is hard to detect a genuine effect, whatever we do. When the effect size is small it is still hard to detect an effect even when we have 80 primary studies using the traditional economics meta-regression model ("basic model"). Our "extended model" which controls for the number of lags really helps a lot in this situation. With large primary study sizes it is quite easy to detect a true effect with only 20 studies in the meta-analysis and our method adds little value. However, the energy-GDP causality literature has mostly small similar sized samples and is trying to detect what is quite a small effect in the energy causes GDP direction (elasticity of 0.05 or 0.1). Our approach has much to offer in this context.

Wednesday, June 10, 2015

Two Papers Accepted for Publication

Two of our papers have just been accepted for publication. One is my paper with Yingying Lu on sensitivity analysis of climate policy computable general equilibrium models. It has been accepted for publication in Environmental and Resource Economics. The other is a paper with George Halkos and Nikalaos Tzeremes. The paper is on environmental efficiency across the U.S. States and has been accepted by the Journal of Cleaner Production. We haven't put out a working paper version of this one. I'll do a blogpost on it when it is available online at the journal. George was a lecturer at University of York when I was a post-doc there.

In the case of the first paper, we only sent it to one journal (JEEM) before the one it was finally published in. We sent the second paper to quite a few journals but managed to get it into one with a pretty high impact factor after significant revision.

Monday, June 8, 2015

Update

Haven't blogged for over a month. Partly this is because I am doing more tweeting and also because I have been busy with the end of semester and traveling to Turkey (IAEE conference), Israel, and Abu Dhabi (International Energy Workshop). This was my first time attending the IEW. I think there is good feedback in the parallel sessions - better than at the IAEE meeting. On the other hand, the IAEE plenaries are more consistent, I think. IEW is strongly tied to the ETSAP modeling forum, which precedes it - TIMES/MARKAL models - and is attended by "modelers" rather than the mix of business, government, and academic communities at IAEE.

In other news, our paper on the behavior of carbon dioxide emissions in the short-run has been published in Global Environmental Change. The article is open access until 26 July. Also our survey paper in the Review of Economics is also open access.

Wednesday, May 6, 2015

Research Assessment Using Early Citation Information

A new paper with Stephan Bruns on carrying out research assessment like the UK REF and the Australian ERA using citations data rather than peer review. We did a lot of the work of processing the data (doing fancy things with R and manually checking names of universities in Excel) when I visited Stephan in Kassel in November.

The problem with research assessment as carried out in Britain and in the social sciences in Australia is that publications that have already passed through a peer review process are again peer reviewed by the assessment panels. This involves a significant workload for many academics who are supposed to read these papers as well as the effort a each university put into selecting the publications that will be reviewed. However, this second peer review though is inferior to the first. If instead citation based metrics were used the whole process could be done much faster and cheaper. In Australia the natural sciences and psychology are assessed using citation analysis. I think this can be extended to at least some other social sciences including economics.

UK REF panels can also put some weight on citations data in some disciplines including most natural sciences and economics, but only as a positive indicator of academic significance and in very much a secondary role to peer review. This represents a change from the previous RAE, which prohibited the use of citations data by panels. This paper provides additional evidence on the potential effectiveness of citation analysis as a method of research assessment. We hope our results can inform the future development of assessment exercises such as the REF and ERA.

One reason why citations analysis is less accepted in the social sciences than in the natural sciences is the belief that citations accumulate too slowly in most social sciences such as economics to be useful for short-term research assessmen.

My 2014 paper in PLoS ONE shows that long-run citations to articles in economics and political science are fairly predictable from the first few years of citations to those articles. However, research assessment evaluates universities rather than single articles. In this new paper, we show that rank correlations are greatly increased when we aggregate over the economics publications of a university and also when we aggregate publications over time. The rank correlation for UK universities for citations received till the end of 2004 (2005) by economics articles published in 2003 and 2004 with total citations to those articles received through 2014 is 0.91 (0.97). These are high correlations. Correlations for Australia are a bit lower.

Our results here show that at the department or university level citations definitely accumulate fast enough in economics in order to be able to predict longer run citation outcomes of recent publications. It's not true that citations accumulate too slowly in the social sciences to be used in research assessment.

On the other hand, the rank correlation between our early citations indicators and the outcome of research assessment exercises in the UK and Australia ranges from 0.67-0.76. These results suggest that citation analysis is useful for research assessment in economics if the assessor is willing to use cumulative citations as a measure of research strength, though there do appear to be some systematic differences between peer-review based research assessment and our citation analysis, especially in the UK. Part of the difference will emerge due to the differences between the sample of publications we selected to assess and the publications actually selected in the 2010 ERA and 2008 RAE.